Our High Ambition pathway for India shows that total greenhouse gas (GHG) emissions (including Land Use, Land Use Change and Forestry (LULUCF)) peak before 2030 and achieve an 8-12% reduction by 2035 from the peak level, which indicates an increase of 14-18% from 2023 levels. This translates to an estimate of CO2 emission intensity reduction by 63% to 73% from 2005 levels by 2035, depending on GDP growth rate assumptions. As of September 1, 2025, India has not announced its 2035 Nationally Determined Contribution (NDC) target. Its 2030 NDC commits to reduce CO2 intensity (excluding LULUCF) by 45% from 2005,1 which may translate to a 2-23% increase in CO2 emissions from 2023 under a range of different GDP growth rates. India’s GHG emissions (including LULUCF) have more than doubled from 2005 to 2023.2 Large uncertainties exist in estimating the country’s progress towards its carbon intensity target, where different historical emissions and GDP trajectories may lead to very different conclusions.3,4 India has also committed to achieving net-zero emissions by 2070.
Recent emissions growth has largely been driven by the power CO2 and industry CO2.2,5 To achieve the High Ambition 2035 target, key mitigation strategies include: maintaining a sustainable electricity demand growth below 5% annually; accelerating solar and wind buildout to about 3 times the current level; cancelling new coal power projects that are at pre-construction (81 GW) and under construction (29 GW); shifting to low-carbon electric furnaces in the iron and steel industry; and expanding opportunities for circular economies.6,7
2035 Target: Total GHG Emissions Reductions
via CGS High Ambition Pathways
-8 to -12%
Relative to Estimated Peak Year
2030**
Official 2035 NDC target
Not announced
Official 2030 NDC target
-45%ⱽ
Net zero target
2070
A High Ambition 2035 target for India shows a 14-18% increase in GHG emissions (including LULUCF) from 2023 levels, or a 2-6% increase excluding LULUCF (Figure 1). Under our High Ambition pathway, emissions stabilize between 2025 and 2030, then decline thereafter toward achieving net-zero CO2 emissions by 2070. In this scenario, total GHG emissions increase by 26-30% to the peak level in 2030 from 2023, then decline by 8-12% from the peak to 2035.
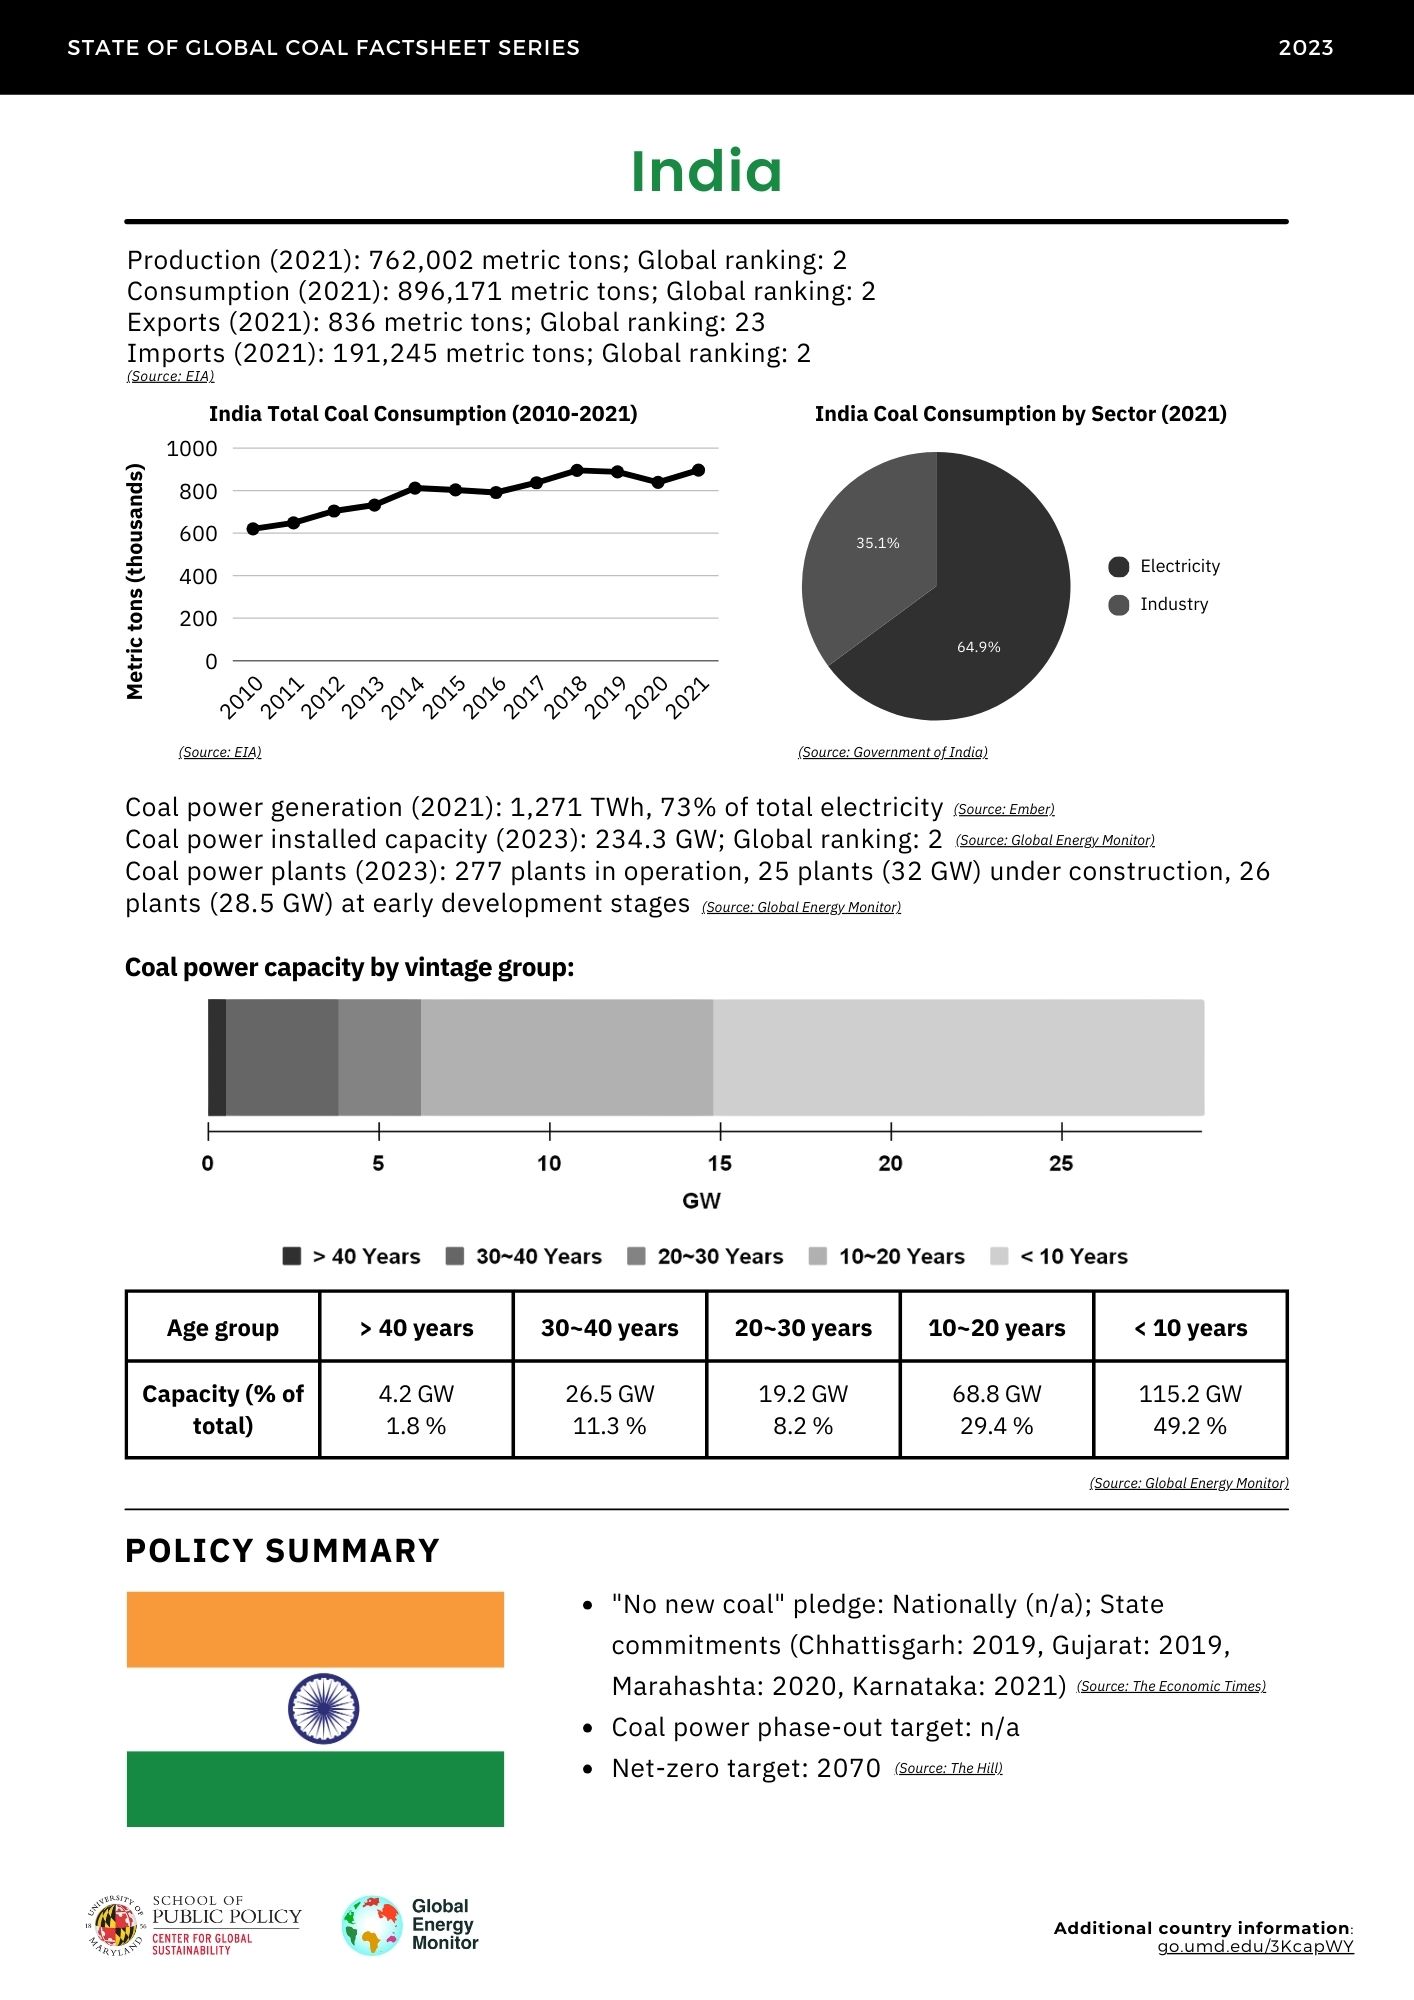
India’s GHG emissions have been increasing over the past two decades, more than doubling from 2005 to 2023.2 The increase has been largely driven by CO2 emissions from the power and industry sectors, which accounted for 40% and 18% of total GHG emissions, excluding LULUCF, in 2022, respectively. Although methane contributed 21% of emissions in 2022, its level has remained relatively stable over time. The NDC targets a 45% reduction in carbon intensity of the economy by 2030 from 2005 levels, as well as achieving net-zero GHG emissions by 2070 and several other subtargets.1 Other research suggests India’s NDC will be achievable,3,4 but there is significant uncertainty on current progress toward achieving that goal, as the emissions intensity target is sensitive to GDP growth assumptions and emissions inventory and GDP sources. Research has suggested that achieving the NDC target will lead to an increase in emissions,4,10 which based on our analysis, could lead to a 2-23% increase in CO2 emissions (excl. LULUCF) from 2023 across a range of GDP growth rates (6% to 8.9%).11,12 Our modeling suggests a 16% increase in total GHG emissions excluding LULUCF and a 5% rise in CO₂ emissions from 2023 to 2030 under the High Ambition scenario. Although CO2 emissions in these trajectories are roughly aligned with the current 2030 NDC target, GHG emissions are not, as there are enhanced reductions in non-CO2 gases by 2030.
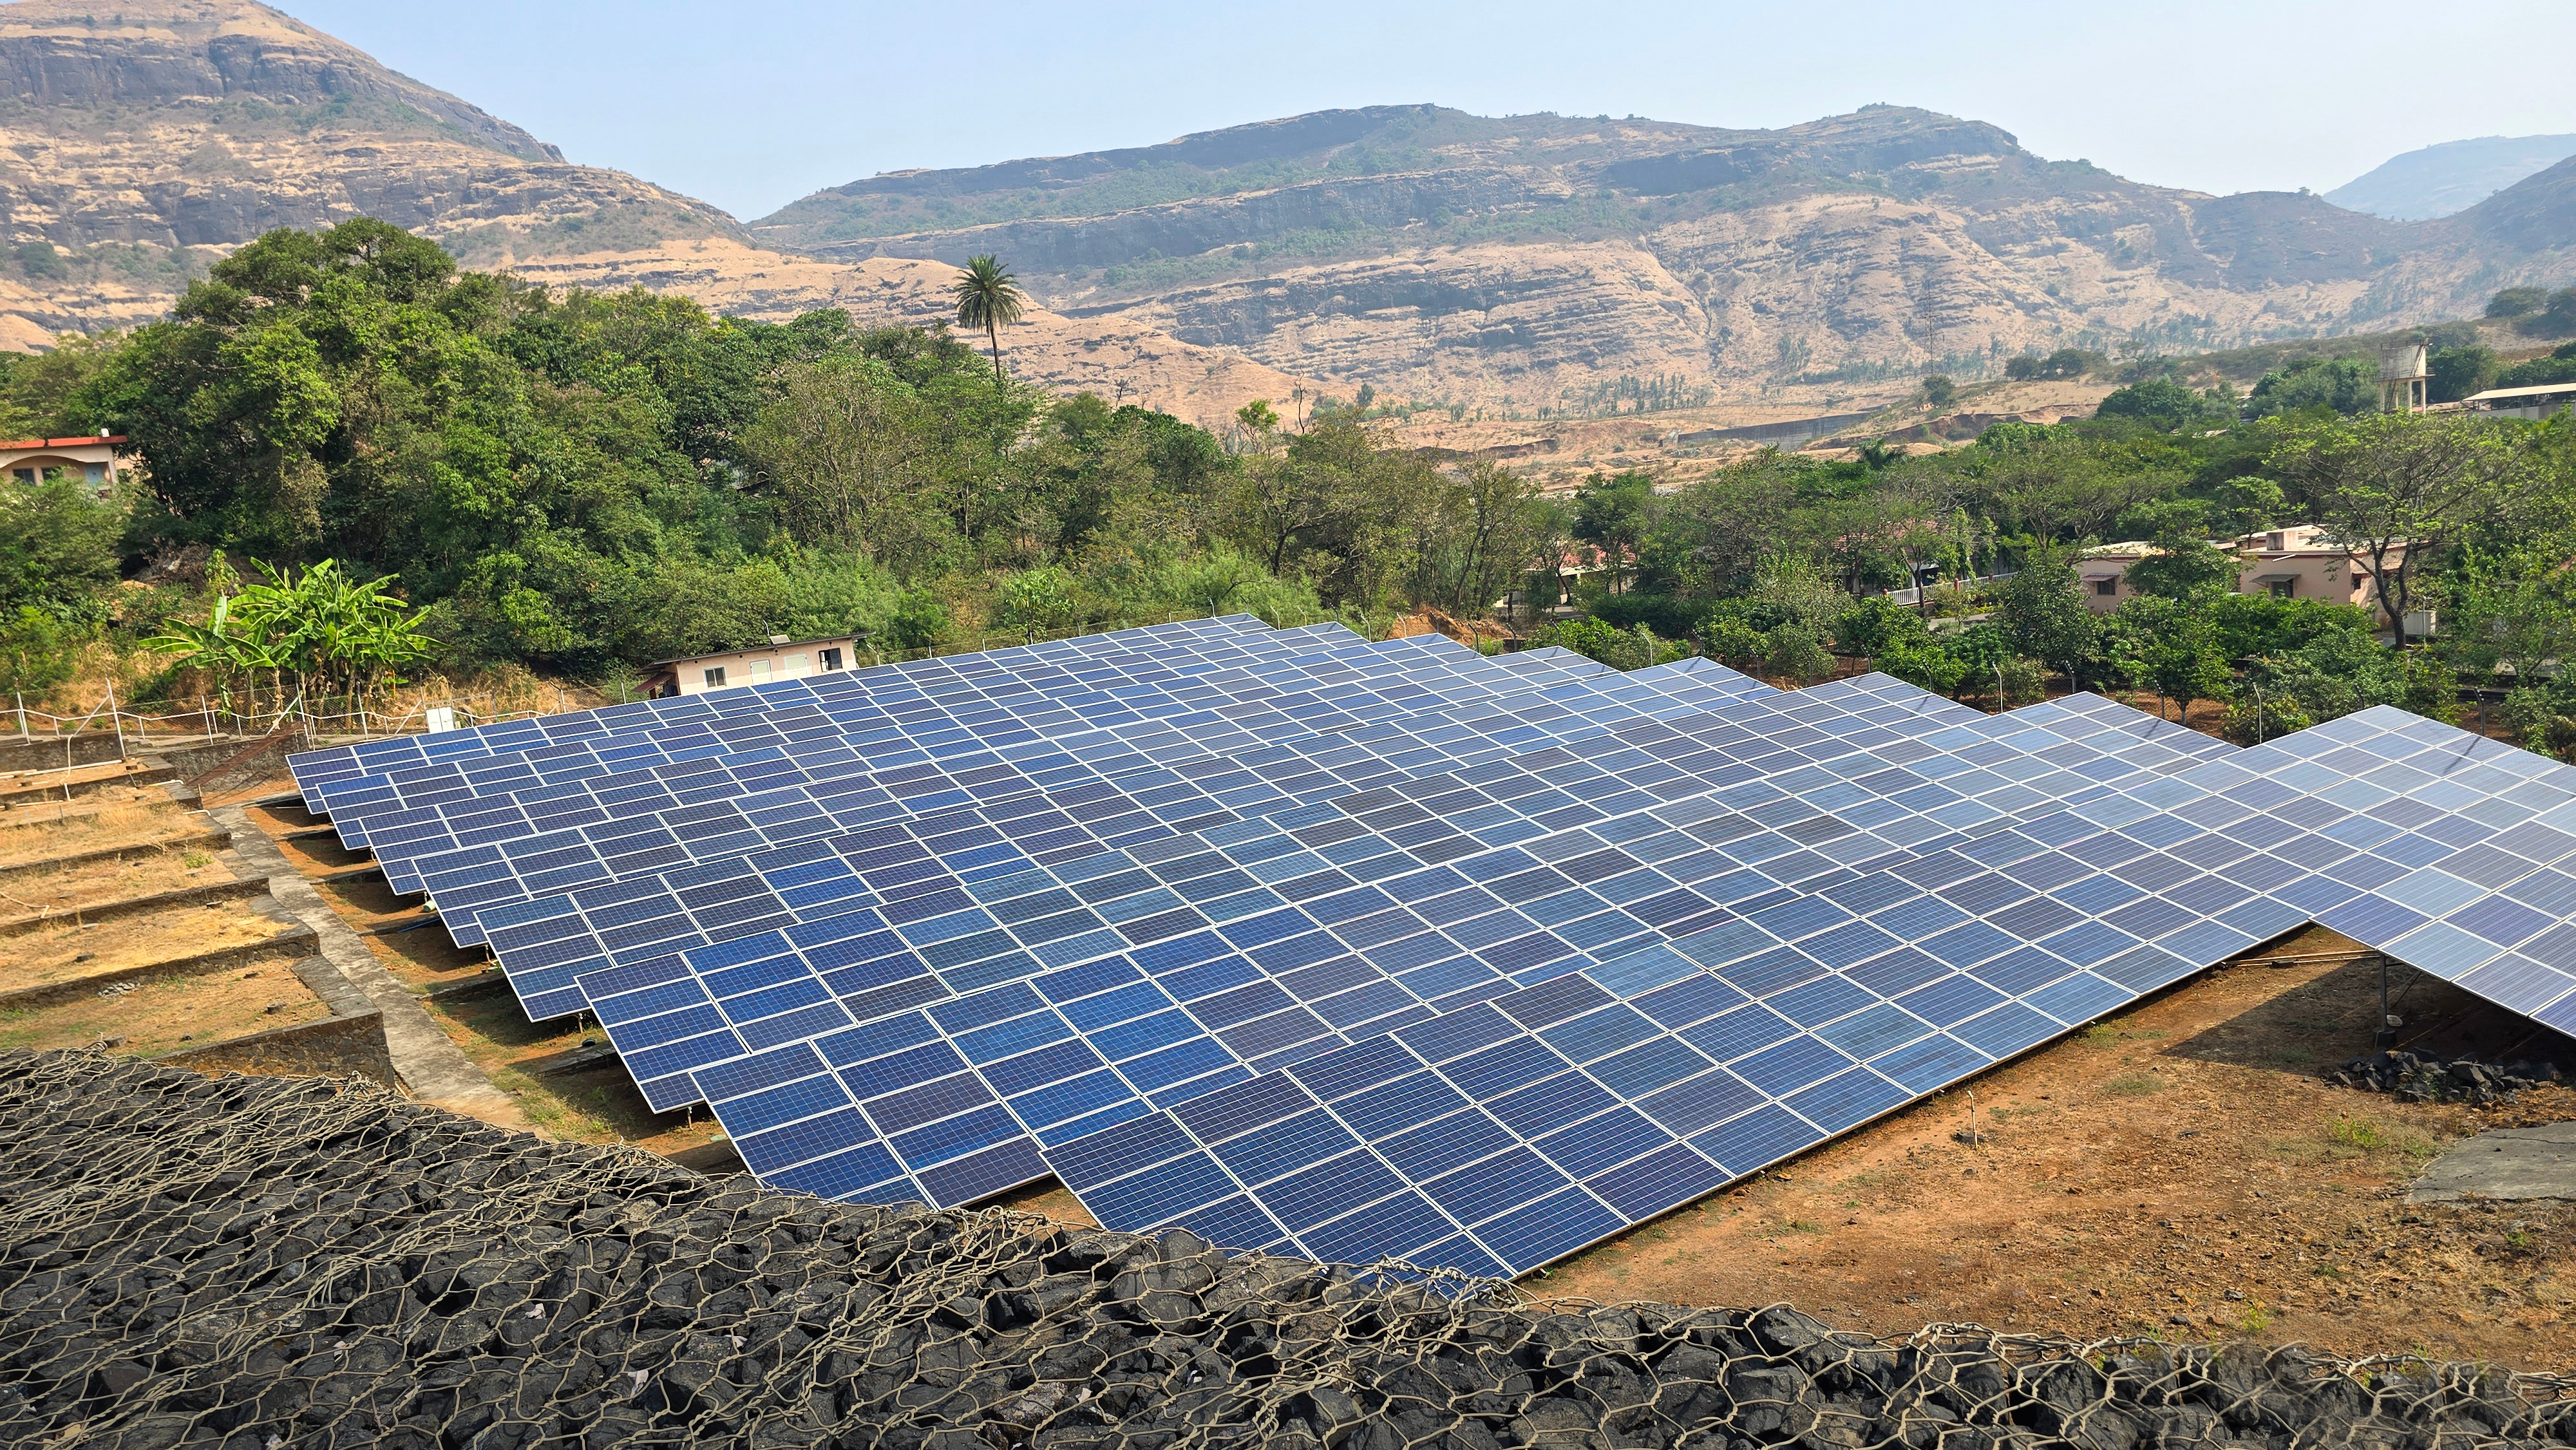
As of 2024, coal accounted for 75% of total electricity generation, while renewables provided 20%, with solar and wind contributing 11% and hydro 8% (Figure 2).8 Coal power plants account for 48% of total installed capacity,8 and the current pipeline includes 29 GW of coal power under construction, and 81 GW under pre-construction stages (pre-permit, permit, and announced).13 The rate of approvals for pre-construction plants has nearly doubled over the past year, rising from 45 GW in 2024 to 81 GW by 2025.13 In 2024, renewable power plants account for 40% of total capacity, with solar and wind representing 19% and 10%, respectively.8 Annual solar and wind deployment increased fivefold from 2020 to 2024, reaching 28 GW/year in 2024.8
While recent growth in wind and solar power installations, along with existing hydro capacity, creates strong potential for transitioning away from coal, the pace of future renewable buildout will determine the power sector’s ability to reduce emissions. Alternative power sector scenarios using a bottom-up approach were developed, considering different renewable energy deployment and demand projections:
- Starting with a baseline from India’s National Electricity Plan (NEP),14 which has solar and wind capacity increase to 259 GW by 2027 and 487 GW by 2032, compared to 146 GW in 2024 (annual buildout of 37 GW/year). Under this scenario, coal generation and power sector emissions continue to grow and peak after 2035.
- Several High Ambition scenarios were developed by further accelerating solar and wind buildout beyond the NEP, and back calculating the impact on coal generation and emissions under alternative demand projections (4% to 6%), assuming other technologies follow the NEP.
A High Ambition scenario that achieves meaningful electricity emissions reductions (around ~30%) by 2035 requires sustainable demand growth, accelerated renewable deployment, and the cancellation of new coal projects, along with the retirement or reduced utilization of existing coal plants. Specifically, power sector transitions under the High Ambition pathway include:
- Maintaining electricity demand growth below 5% annually, through efficiency improvements and demand-side management.
- Accelerating annual solar and wind buildout to 2 - 2.5 times the NEP, from the 2024 level of 28 GW/year to 74 GW/year through 2035 under low-demand growth (4%/year), or to 93 GW/year under high demand growth (5%/year).
- Increasing the share of non-fossil generation from 22% in 2024 to exceeding 50% by 2030 and 65% by 2035.
- Canceling the 81 GW of pre-construction and some of the 29 GW of coal power projects under construction, as those are already more expensive than using solar energy to meet increasing demand.
Coal production increased by 60% over the last decade, reaching a record high in 2024 (Figure 3). India is also a significant importer of liquified natural gas (LNG) (5% of global LNG imports)16 and has been expanding fossil gas infrastructure to further increase import capacity. India is also projected to be the largest source of global oil demand growth by 2030.17 Under our High Ambition pathway for India, domestic coal demand declines by 23% by 2030 and 40% by 2035, while gas demand increases by 86% and 115%, and oil demand increases by 31% and 34%, respectively (Figure 3).
Citations
Government of India. India’s Updated First Nationally Determined Contribution Under Paris Agreement. (2021).
Gütschow, J., Pflüger, M. & Busch, D. The PRIMAP-hist national historical emissions time series (1750-2023) v2.6.1. Zenodo
https://doi.org/10.5281/zenodo.15016289 (2025).
Climate Action Tracker. India. Country summary. Climate Action Tracker https://climateactiontracker.org/countries/india/ (2024).
Das, P. et al. A new scenario set for informing pathways to India’s next nationally determined contribution and 2070 net-zero target: structural reforms, LIFE, and sectoral pathways. Energy Clim. Change 6, 100192 (2025).
Hoesly, R. et al. CEDS v_2025_03_18 Gridded Data 0.5 degree. Zenodo (2025).
Sharma, P., N, R., Kanwar, H. & Vora, M. Chance of a lifetime: Can India show the developing world a unique path to net zero? Wood Mackenzie
https://www.woodmac.com/horizons/india-net-zero-path/ (2024).
Ministry of Housing and Urban-Rural Development. Circular Economy in Municipal Solid and Liquid Waste.
https://mohua.gov.in/upload/whatsnew/627b833ecac62Circular-Economy-in-waste-management-FINAL.pdf (2021).
Ember. Electricity Data Explorer - Open Source Global Electricity Data. Ember (2025).
NGFS. NGFS Climate Scenarios for Central Banks and Supervisors - Phase V. The Central Banks and Supervisors Network for Greening the Financial System (NGFS) (2024).
Sudharmma Vishwanathan, S., Fragkos, P., Fragkiadakis, K. & Garg, A. Assessing enhanced NDC and climate compatible development pathways for India. Energy Strategy Rev. 49, 101152 (2023).
Reserve Bank of India. Database on Indian Economy. RBI
https://data.rbi.org.in/#/dbie/home (2025).
Singh, C., Vishandass, A., Chand, R., Kaur, B. & Sachdeva, S. A. S. Draft Project Report on ‘India Vision 2036-37’. A Macro Econometric Approach
https://niti.gov.in/sites/default/files/2023-03/India%20Vision%202036-37%20A%20Macro%20Econometric%20Approach.pdf (2023).
GEM. Global Coal Plant Tracker (GCPT). Global Energy Monitor (GEM) (2025).
Central Electricity Authority (CEA) - Ministry of Power. National Electricity Plan (Volume I). (2023).
KPMG & Kearney. Statistical Review of World Energy, 73rd Edition. Energy Insitute
https://www.energyinst.org/statistical-review/resources-and-data-downloads (2024).
U.S. Energy Information Administration. Country Analysis Brief: India.
https://www.eia.gov/international/content/analysis/countries_long/India/pdf/India.pdf (2025).
IEA. Executive summary – Indian Oil Market – Analysis. International Energy Agency (IEA)
https://www.iea.org/reports/indian-oil-market/executive-summary (2024).
Our Work
Other CGS Research
Enhancing Global Ambition for 2035: Assessment of High-Ambition Country Pathways
Implications of an emission trading scheme for India’s net-zero strategy: a modelling-based assessment
The State of Global Coal Power Factsheet Series: India